
Exploring
Parameters of a Polar Function
By: Sydney
Roberts
For this
exploration we will be comparing the graph of ![]() with the graph of
with the graph of ![]() for various values of k.
for various values of k.
Let’s first look at
different graphs of ![]() for different integers
b and k.
for different integers
b and k.
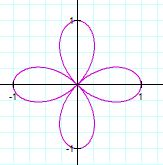
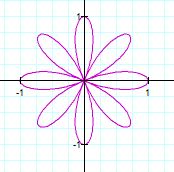
When b=1, k=1 When b=1, k=2

When b=1, k=3 When b=1, k=4

When b=1, k=5 When
b=1, k=6

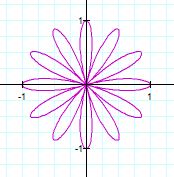
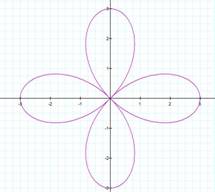
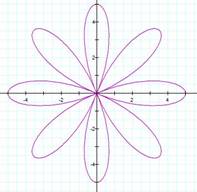
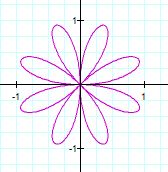
It appears
as if k determines the number of petals the graph will have. Notice that when k
is odd, then the number of total petals is k, and when k is even then the
number of total petals is 2k. To see how the parameter b affects the graph, we
will not vary b.
When b=2, k=2 When b=3, k=2

When b=4, k=3 When b=5, k=4

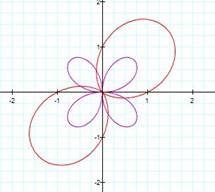
From this we
can see that b determines the length of each of the petals. Therefore, the
parameter b will not change the overall “look” of the graph. Hence, to compare ![]() with the graph of
with the graph of ![]() we
will only consider when b=1. Below are different graphs comparing the two.
we
will only consider when b=1. Below are different graphs comparing the two.
When a=1, k=1 When a=2, k=1

When a=3, k=1 When a=1, k=2

When a=2, k=3 When a=3, k=3

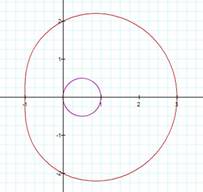
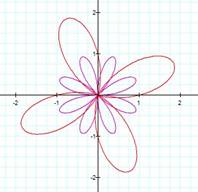
Notice that
a changes two things. First, a determines the maximum
distance ![]() will be away from
will be away from ![]() and that distance is |a|. Secondly, as a increases,
and that distance is |a|. Secondly, as a increases, ![]() becomes a smoother curve. For a better view of
how the parameter a affects the graph, view the
animation below which shows k=2 and a varying from -5 to 5. Notice that as a becomes negative, the maximum distance from
becomes a smoother curve. For a better view of
how the parameter a affects the graph, view the
animation below which shows k=2 and a varying from -5 to 5. Notice that as a becomes negative, the maximum distance from ![]() to
to
![]() shifts from lying on the x-axis to lying on
the y-axis.
shifts from lying on the x-axis to lying on
the y-axis.
Now, what would happen
if ![]() instead of
instead of ![]() ?
?
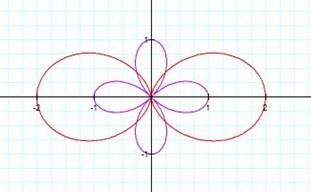
Well, consider the
graphs below.


Hopefully
you noticed that sine instead of cosine only rotates the graph, but doesn’t
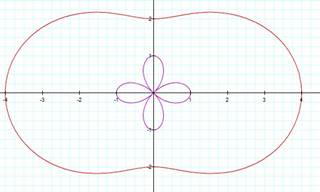
change the shape of it. Now let’s look at the same graphs except this time
compared to ![]() .
.


Again,
notice that this only rotates the graph.